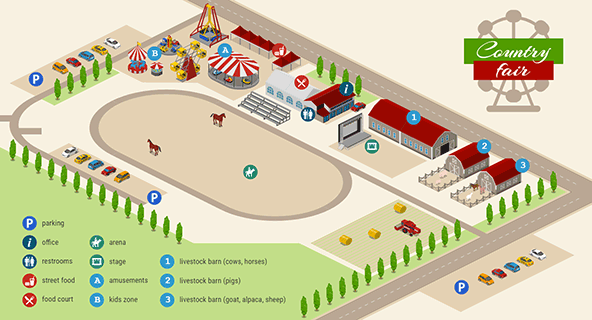
Farm Maps

Design Farm Maps for Efficient Planning and Communication with Icograms Designer.

What you can create using Icograms Designer

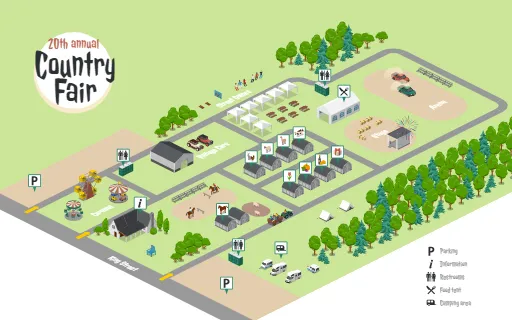
Do you need a farm map for your visitors? Do you need to create illustrations and diagrams of farming, its processes, or farm maps to help communicate your ideas and designs to your clients or stakeholders? Are you a software company designing IoT products for use in agriculture?

Look no further than Icograms Designer! Our software makes it easy to create detailed and professional-looking illustrations and diagrams that accurately represent the complexities of farming and agriculture.

Here are just a few of the benefits of using Icograms Designer for your agriculture-related illustrations and diagrams:
  • Customizable Icons and Elements: Our software comes with a vast library of customizable icons and elements that you can use to create accurate and visually appealing illustrations and diagrams of farming and agriculture processes. You can easily modify the colors, shapes, and sizes of these elements to fit your specific needs.
  • Ease of Use: You don't need to be a professional designer or artist to use Icograms Designer. Our intuitive interface and drag-and-drop functionality make it easy for anyone to create high-quality illustrations and diagrams in a matter of minutes.
  • Flexibility: Icograms Designer allows you to create a wide range of illustrations and diagrams related to farming and agriculture, including farm maps, process diagrams, and equipment illustrations. You can easily adjust the scale, layout, and level of detail to fit your specific needs.
  • Time and Cost Savings: With Icograms Designer, you can create professional-looking illustrations and diagrams in-house, saving you time and money compared to hiring a professional designer or outsourcing the work.
Don't let the complexities of farming and agriculture processes hold you back from effectively communicating your ideas and designs. Try Icograms Designer today and experience the benefits of creating accurate, professional-looking illustrations and diagrams for your agriculture-related IoT products.

How to work with Icograms Designer

Icograms Designer is an online vector graphic editor with an extensive built-in graphics collection. Our graphic library currently contains over 964 icons and 4,823 templates across a wide range of categories. This collection is continuously growing as we regularly add new icons and templates.

You can start your project from scratch or customize one of our templates.

To get started from scratch

  • Open Icograms Designer
  • Drag and drop icons to the work area
  • Utilize clone tools and copy/paste functions to increase efficiency
  • Move, resize, and recolor icons to find the best solution
  • Add text and symbols to enhance your design.
  • Upload your own graphics if needed
  • Export the created graphics

To get started from a template

  • Choose a suitable template
  • Drag and drop additional graphics if necessary
  • Insert your own text using text boxes
  • Customize your design by changing colors, fonts, and icons
  • Upload your own graphics if needed
  • Export the created graphics

Farm Maps related Templates

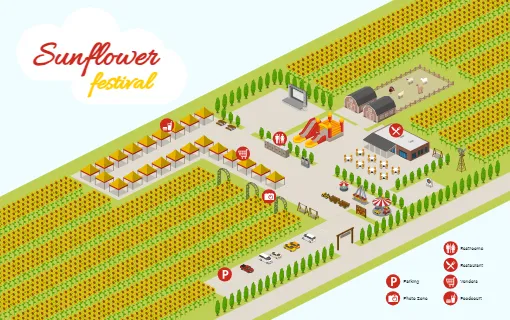
Sunflower Festival
Sunflower Festival
Lavender Festival
Lavender Festival
Pumpkin Festival
Pumpkin Festival
Hydroponic Farming
Hydroponic Farming
Rainbow Trout Farming
Area - Rural
Area - Rural
Area - Spring Field
Area - Spring Field
Area - Autumn Field
Area - Autumn Field
Area - Nature
Area - Nature
Area - Forest
Area - Forest
Wheat Timeline Template
Controlled-Environment Agriculture
5G in Agriculture
5G in Agriculture
Green Infrastructure Components
Urban Heat Island Effect
Bar Chart
Bar Chart
Farm Advertisement
Farm Advertisement
Transportation - Agriculture - Cargo
Field Word
Field Word
Farm Word
Farm Word