What Exactly Is a Technical Illustration?
In simple terms, a technical illustration is a visual way to explain technical information. A technical illustration is like the translator between the technical world and everyday people. It takes complex systems, machines, or processes and turns them into visuals that people can quickly understand. Instead of long pages of technical documents, you get a picture that tells the story in seconds. Think about factory layouts, supply chain diagrams, IT networks, or construction plans. A good technical illustration can explain all of these without leaving you scratching your head. It’s a mix of precision and clarity, with just enough visual appeal to make you want to keep looking.Why Use Icograms for Technical Illustrations?
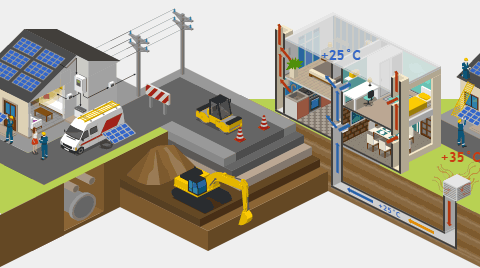
You’ve probably seen traditional technical illustrations that look a little flat. Icograms changes the game with isometric style visuals that bring depth and clarity without overcomplicating the view.Here’s why Icograms makes sense for your projects:
- Isometric art style – It creates a 3D-like look while keeping everything easy to follow.
- Drag-and-drop simplicity – No design degree required. You pick icons, place them, and adjust as needed.
- Massive icon library – From factories to transport, IT to medical, there’s always an icon that fits your needs. If you can’t find the icon you’re looking for, you can even order a custom one.
- Export flexibility – Need it for a presentation, a report, or a website? Export in PNG or SVG and you’re ready.
Practical Uses for Technical Illustrations
You may be wondering—where do you actually use technical images? The answer: just about anywhere!- Manufacturing plants: Show how materials flow from raw input to finished product in a way that your team understands instantly.
- Engineering projects: Map out designs, layouts, and processes without drowning in details that only insiders understand.
- Education and training: Teachers and trainers can simplify complicated topics with diagrams that actually stick in people’s memory.
- Business presentations: Instead of ten slides full of text, use one clean technical infographic to impress investors or partners.
- Urban planning: City layouts, infrastructure, or utility networks can all be shown in a way that feels approachable.
Turning Complexity into Clarity
The hardest part of technical communication is cutting through the noise. People don’t always want to know every single detail; they want the big picture, and they want it fast. That’s where Icograms excels. Instead of endless bullet points, you can map out a process flow with arrows, icons, and environments. Instead of vague descriptions, you can show an isometric diagram of how equipment fits in a factory so people can immediately understand how everything works.With Icograms, you can create visuals that balance accuracy, clarity, and creativity. Whether you’re showing a process, explaining a workflow, or designing a system, you’ll find that your ideas become easier to share and more enjoyable to look at. So next time you need to explain something complicated, don’t just write it down—illustrate it. With the right visuals, your audience will thank you for making the tough stuff simple.


 System")


